In August 2025, Pakistan’s Large-Scale Manufacturing (LSM) sector recorded a 2.75% month-on-month decline in production. However, during the first two months of fiscal year 2026, the sector managed to maintain a positive growth rate on a year-on-year basis.
According to data released by the Pakistan Bureau of Statistics (PBS), overall LSM output grew by 4.44% between July and August 2025–26 compared to the same period last year.
On a year-on-year basis, LSM output in August 2025 increased by 0.54% compared to August 2024, but declined by 2.75% compared to July 2025. Notably, the sector had posted a strong 9% annual growth in July.
Sectors that contributed significantly to the 4.44% cumulative growth in LSM based on their weighted contribution include:
- Food (1.02),
- Tobacco (0.17),
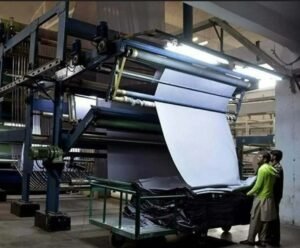
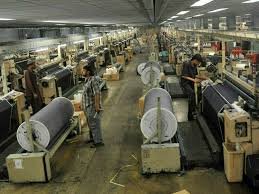
- Textiles (-0.03),
- Garments (0.84),
- Paper & Board (0.21),
- Petroleum Products (-0.21),
- Chemicals (-0.13),
- Pharmaceuticals (-0.11),
- Cement (0.98),
- Iron & Steel Products (-0.16),
- Electrical Equipment (0.08),
- Machinery & Equipment (-0.11),
- Automobiles (1.83),
- Other Transport Equipment (0.23),
- Furniture (-0.17).
Sector-Wise Performance: July–August FY2026 vs. Last Year
Sectors with positive growth included:
- Food: 7.77%
- Tobacco: 11.06%
- Garments: 4.92%
- Paper & Board: 8.41%
- Rubber Products: 24.9%
- Non-Metallic Mineral Products: 17.31%
- Automobiles: 90.4%
- Other Transport Equipment: 44.47%
- Other Manufacturing (including footballs): 19.35%
Sectors that recorded a decline during July–August FY2026 compared to the same period last year were:
- Beverages: -2.68%
- Textiles: -0.15%
- Wood Products: -1.65%
- Coke & Petroleum Products: -2.69%
- Chemicals & Fertilizers: -1.47%
- Pharmaceuticals: -1.77%
- Iron & Steel Products: -3.44%
- Fabricated Metal Products: -0.19%
- Machinery & Equipment: -33.84%
- Furniture: -10.84%